
GLM-5.2 Streaming Latency: TTFT vs First Visible Token
Independent research — not an official Z.ai publication.Identity and provider disclosure

Original editorial illustration. The measured screenshot and sanitized timing data appear below.
“Time to first token” sounds like one stopwatch. A reasoning model makes it at least three: the first parseable server-sent event, the first hidden reasoning fragment, and the first non-empty content a person can actually see. Queueing, buffering, concurrency, the output allowance, and the client’s own parser can move those clocks independently.
We ran 44 measured GLM-5.2 streaming requests in a disposable Docker environment, with 3 excluded warm-ups. The test used one named Coding Plan route, one host, one account, and one date. It was designed to answer a narrow practical question: what should an application record so that a GLM-5.2 latency number describes the user experience rather than a convenient but misleading event?
This is not another fastest-provider leaderboard. Public routing dashboards are useful for shortlisting providers, but they use their own traffic, aggregation windows, prompt mix, token definitions, and delivery instrumentation. The results below stay attached to our route, prompt, output cap, concurrency, and client.
Read this GLM-5.2 timing report
Section titled “Read this GLM-5.2 timing report”- Define the six stream clocks
- Inspect the dated test boundary
- Review sequential timing
- Measure the concurrent tail
- See the output-cap failure
- Compare a relaxed prompt
- Detect buffered delivery
- Copy the instrumentation pattern
- Build an acceptance gate
- Place this test in the stack
- Resolve common measurement questions
- Open sources and evidence
One stream needs six clocks, not one TTFT number
Section titled “One stream needs six clocks, not one TTFT number”Use a monotonic clock and record events from the caller’s point of view. Wall-clock timestamps are useful for logs, but clock adjustments make them unsafe for durations.
| Caller-observed clock | Start and stop | What it tells you |
|---|---|---|
| Response headers | Request start → headers received | Combined connection, gateway, queue, and time before the response body |
| First JSON SSE event | Request start → first parseable data: object |
The stream is active; it may contain no visible text |
| First reasoning fragment | Request start → first non-empty delta.reasoning_content |
Hidden work has begun reaching the client |
| First visible content | Request start → first non-empty delta.content |
The earliest point at which the UI can show answer text |
| Last visible content | Request start → last non-empty content delta | The apparent end of text delivery, before accounting closes |
| Complete stream | Request start → terminal usage, finish reason, and [DONE] |
Whether the protocol completed and why generation stopped |
Call the fourth clock time to first visible content or TTFC. If your product uses “TTFT,” define the token field beside the metric. Counting a role-only event or a hidden reasoning delta as the first token improves a chart without improving the wait a user feels.
The official Z.ai streaming guide describes incremental delta.content, a terminal finish reason and usage, followed by [DONE]. Its thinking guide keeps reasoning separate from visible content. Those wire fields make separate clocks possible; they do not make one field a universal industry definition.
Protocol success and task success also need separate columns. HTTP 200, a parseable SSE stream, and [DONE] can coexist with finish_reason=length, an empty visible answer, or a missing task marker. We observed all three patterns.
Reproduce the dated route and container boundary
Section titled “Reproduce the dated route and container boundary”The requests ran on July 28, 2026 against:
product: Z.ai Coding Planendpoint: https://api.z.ai/api/coding/paas/v4/chat/completionsmodel request: glm-5.2model return: glm-5.2sampling: do_sample=falsecache: unique nonce first; cached_tokens observed as 0percentiles: p50 median; p90 nearest rankZ.ai documents Coding Plan as a subscription for supported AI coding tools. Testing that route does not turn it into a general-purpose production backend. For an application service, select and test a metered route under its own terms.
The standard-library Python probe ran in the digest-pinned image
ghcr.io/astral-sh/uv@sha256:41977070f8f7a569ba48da4641bf5212421625e02763bbca24d6fe599ac62a91.
It used UID/GID 1000, a read-only root filesystem, dropped Linux capabilities, 256 MiB memory, one CPU, a 64-PID ceiling, and no published port. This host’s previously documented Docker bridge DNS behavior required host networking for outbound HTTPS; the container opened no listener and was removed after the run.
The main prompt asked for exactly 96 English words about bounded-queue backpressure and required an END marker. Each request started with a unique nonce. We stored event times, counts, usage, finish reasons, success flags, and content hashes—but no API key, authorization header, response ID, visible model text, or reasoning text.
| Evidence scope | Value |
|---|---|
| Measured requests | 44 |
| Excluded warm-ups | 3 |
| HTTP and SSE completions | 44/44 |
| Strict sequential, thinking disabled | 10 |
| Strict concurrent, thinking disabled | 9 in three waves |
| Strict thinking enabled, 384-token cap | 10 |
| Strict thinking enabled, 1,024-token cap | 5 |
| Relaxed prompt pair | 5 disabled + 5 enabled |
Forty-four calls are enough to reveal measurement bugs and form a pilot hypothesis. They are not enough to infer uptime, capacity, a stable daily distribution, or an SLA.
Sequential visible-token wait clustered around three seconds
Section titled “Sequential visible-token wait clustered around three seconds”With thinking disabled and one request at a time, all ten strict requests completed the SSE protocol and included the required marker.
| Sequential metric | p50 | p90 | Minimum | Maximum |
|---|---|---|---|---|
| First visible content | 2.972 s | 3.795 s | 2.388 s | 3.901 s |
Full stream to [DONE] |
3.612 s | 4.471 s | 2.857 s | 4.864 s |
The p90 here is nearest rank: sort ten values and select the ninth. It is not an interpolated percentile, and it is especially sensitive at this small sample size. Publishing the raw timing array lets a reader recompute another convention instead of reverse-engineering a chart.
For the smoothly delivered requests in this group, dividing API completion_tokens by the interval from first visible content to [DONE] produced a median of 186.072 completion tokens per client-observed stream second, with a range of 97.274–245.320. That rate includes delivery and network behavior. It is not accelerator decode throughput, and it should not be placed beside another service’s tokens-per-second number unless both methods are made compatible.
The practical baseline is therefore not “GLM-5.2 runs at 186 tokens/s.” It is: under this one route, prompt, date, and client, half of ten sequential requests showed answer text by 2.972 seconds, and nine of ten did so by 3.795 seconds. That sentence preserves the evidence needed to challenge or reproduce it.
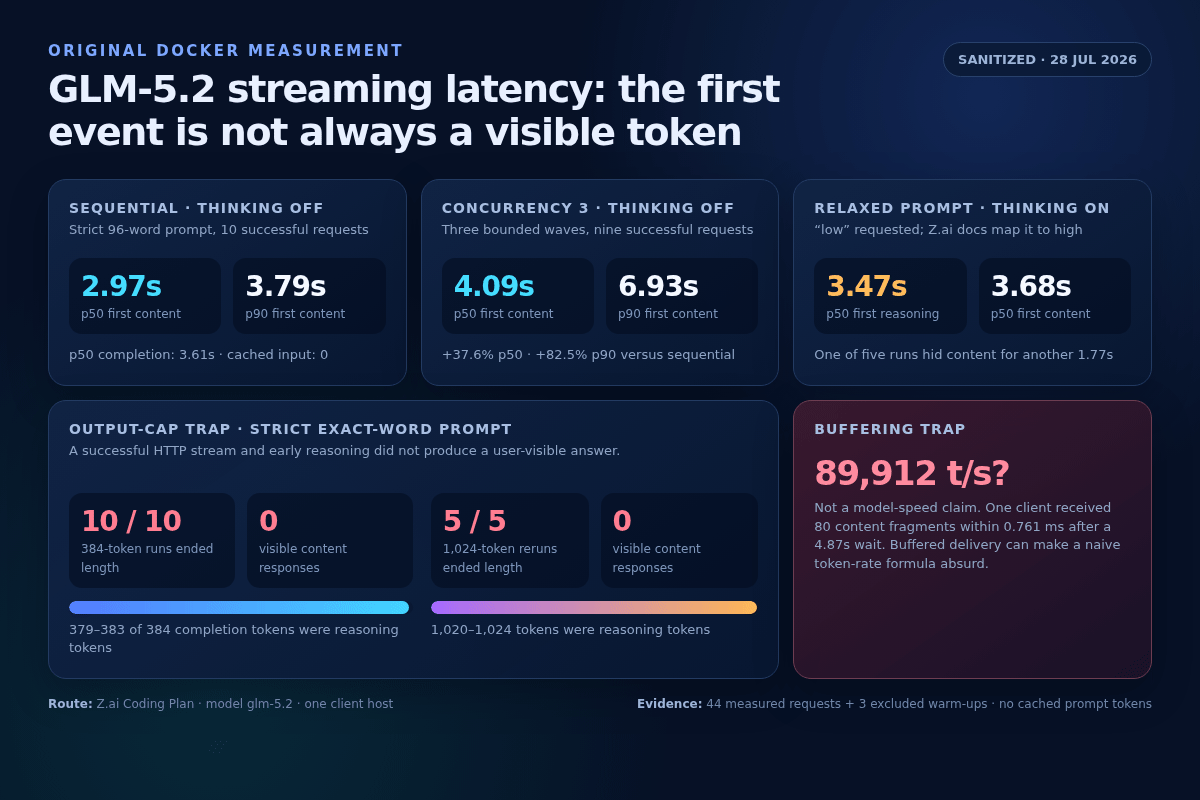
Real screenshot rendered from the sanitized result files. Values are measured; the layout is ours, not a vendor dashboard.
Three simultaneous calls widened the slow tail
Section titled “Three simultaneous calls widened the slow tail”We then launched three waves of three simultaneous requests. All nine returned normal HTTP and SSE completions, but only eight included the required marker.
| Thinking disabled | Sequential, n=10 | Concurrency 3, n=9 | Change |
|---|---|---|---|
| First content p50 | 2.972 s | 4.090 s | +37.6% |
| First content p90 | 3.795 s | 6.927 s | +82.5% |
| Total p50 | 3.612 s | 4.609 s | +27.6% |
| Total p90 | 4.471 s | 8.020 s | +79.4% |
| Required marker | 10/10 | 8/9 | acceptance declined |
This does not prove the provider saturated at three calls. The caller, account controls, gateway, serving queue, shared capacity, and network path are all inside the observed duration. We did not isolate them, and three waves are far too few for capacity planning.
It does show why a sequential demo cannot establish production responsiveness. If the UI permits three parallel agents, test three parallel agents. Track tail latency and task acceptance together: a transport-success rate of 9/9 would have hidden the one instruction miss.
For a larger test, distribute run start times, retain per-request records, predeclare timeouts, and report throttled or failed calls in the denominator. Do not silently retry the slowest samples and then publish only the successful retry.
Hidden reasoning can consume the entire output allowance
Section titled “Hidden reasoning can consume the entire output allowance”The most consequential failure was not a timeout. It was a normal stream with no visible answer.
We repeated the strict prompt with thinking enabled and sent:
{ "thinking": { "type": "enabled" }, "reasoning_effort": "low", "max_tokens": 384}The word requested matters. The current Z.ai Chat Completion reference says GLM-5.2 maps low and medium to high; this is not evidence for an effective low-reasoning tier.
All ten 384-token requests returned HTTP 200, completed SSE, and ended with finish_reason=length. None emitted visible content. Reported reasoning used 379–383 of the 384 completion tokens. Raising the allowance to 1,024 did not repair this particular prompt: all five follow-ups again ended at length, emitted no content, and reported 1,020–1,024 reasoning tokens.
| Strict thinking request | 384-token cap | 1,024-token cap |
|---|---|---|
| Measured calls | 10 | 5 |
| First reasoning p50 | 2.773 s | 2.105 s |
| Full stream p50 | 6.677 s | 10.066 s |
finish_reason=length |
10/10 | 5/5 |
| Visible answers | 0/10 | 0/5 |
The exact 96-word constraint appears to have encouraged extended planning or verification. The test does not prove that thinking mode always consumes the cap, nor that 1,024 is generally insufficient. Official examples use a 4,096-token allowance, but even a larger number is not a substitute for checking the finish reason and visible output.
An interface that announces “the model started in 2.1 seconds” from the first reasoning event would misrepresent these calls. The user received no answer at all.
A relaxed prompt separated reasoning from visible delay
Section titled “A relaxed prompt separated reasoning from visible delay”We removed the exact word-count requirement while retaining a concise paragraph and the END marker. Five thinking-disabled and five thinking-enabled requests then produced visible text and stopped normally.
| Relaxed prompt | Thinking disabled | Thinking enabled, low requested |
|---|---|---|
| First reasoning p50 | n/a | 3.474 s |
| First visible content p50 | 3.461 s | 3.682 s |
| Full stream p50 | 3.708 s | 5.134 s |
| Required marker | 4/5 | 5/5 |
In four of the five thinking-enabled calls, the first visible fragment followed the first reasoning fragment by less than one millisecond. In the fifth, the gap was 1.771 seconds. That tiny sample demonstrates why the two clocks should remain separate; it cannot define a universal thinking penalty.
Prompt shape is part of the benchmark. Replacing the constraint repaired visible completion in this fixture while changing the task. A latency suite should include representative production requests, not a single synthetic sentence repeated until the chart looks stable. It should also score whether the response completed the intended job.
The 89912 tokens-per-second result is a buffering warning
Section titled “The 89912 tokens-per-second result is a buffering warning”One relaxed, thinking-disabled request waited 4.865 seconds before visible delivery and then exposed 80 content fragments inside a client-observed 0.761 milliseconds. A naive formula produced 89,912 tokens/s?
That question mark is mandatory. The value is physically implausible as an inference conclusion from this instrumentation. It indicates that data was buffered or released in a burst somewhere between generation and the Python iterator. Two other flagged observations displayed 2,289 and 2,087 tokens/s under similarly compressed delivery.
A robust client should keep:
- the first and last timestamp for each field type;
- fragment counts and byte counts;
- API token usage;
- the duration from first visible content to terminal accounting;
- a flag for many fragments compressed into an implausibly short interval;
- the wait before that burst.
If delivery is bursty, report total user wait and the burst flag. Do not transform a near-zero denominator into a headline about model hardware. Provider-side decode telemetry can measure accelerator throughput; a remote HTTP client usually cannot isolate it.
Instrument your own stream with monotonic timestamps
Section titled “Instrument your own stream with monotonic timestamps”The following condensed pattern shows the important fields. It assumes an existing payload, reads ZAI_API_KEY from the environment, and deliberately keeps reasoning and content clocks separate:
import json, os, time, urllib.request
endpoint = "https://api.z.ai/api/coding/paas/v4/chat/completions"started = time.monotonic()mark = lambda: (time.monotonic() - started) * 1000first_event = first_reasoning = first_content = last_content = Nonefinish_reason = usage = None
request = urllib.request.Request(    endpoint,    data=json.dumps(payload).encode(),    headers={        "Authorization": f"Bearer {os.environ['ZAI_API_KEY']}",        "Content-Type": "application/json",        "Accept": "text/event-stream",    },)
with urllib.request.urlopen(request, timeout=120) as response:    for raw in response:        line = raw.decode().strip()        if not line.startswith("data:"):            continue        data = line[5:].strip()        if data == "[DONE]":            break        event = json.loads(data)        first_event = first_event or mark()        usage = event.get("usage") or usage        for choice in event.get("choices", []):            finish_reason = choice.get("finish_reason") or finish_reason            delta = choice.get("delta") or {}            if delta.get("reasoning_content") and first_reasoning is None:                first_reasoning = mark()            if delta.get("content"):                first_content = first_content or mark()                last_content = mark()
total = mark()assert finish_reason not in {"length", "content_filter"}assert first_content is not None
For production evidence, add transport and parse errors, header time, terminal [DONE], per-fragment timestamps, content acceptance, token usage, model returned, cache fields, concurrency group, prompt ID, provider, region, and request configuration. Never log credentials or sensitive prompt/response text merely to obtain a percentile.
Our reader-facing timing JSON includes the raw duration arrays, summary statistics, container digest, buffering observations, and limits. It contains no response text or secret.
Turn measurements into a route acceptance gate
Section titled “Turn measurements into a route acceptance gate”Measure what would change a routing decision. A small pilot can use this shape:
workload: 3 representative prompt classes, fixed fixturesroutes: exact provider, product, region, and model revisionwarm-up: excluded and countedrun shape: sequential plus expected concurrencylatency: first visible content and full completion p50/p90quality: task-specific acceptance, including finish reasonreliability: every timeout, 429, transport error, and retrycost: billable tokens and retries per accepted resultburst handling: fragment compression flag, never hiddendecision: thresholds written before results are openedFor example, require at least 95% task acceptance, a first-visible p90 below the interface budget, no increase in severe failures, and an agreed cost per accepted response. Those numbers are examples, not recommendations for every product. The important part is choosing them before seeing which route wins.
OpenRouter’s provider-performance article likewise separates first-token latency, throughput, tail percentiles, uptime, and quality considerations. Its provider-routing reference exposes rolling p50, p75, p90, and p99 criteria. Those metrics are useful shortlist inputs; they do not prove that this prompt, account, client, or future traffic will reproduce a public aggregate.
Test the route you will actually buy. A provider median cannot reveal your client buffering, and our Coding Plan result cannot choose a metered API provider for your backend.
Where this evidence fits in the GLM-5.2 stack
Section titled “Where this evidence fits in the GLM-5.2 stack”This page owns a measurement question, not every streaming or provider question:
- Use the GLM-5.2 streaming API parser guide to reconstruct content, reasoning, usage, tool-call fragments, and terminal events safely.
- Use the reasoning-effort guide to understand accepted controls and output-budget implications before designing timing groups.
- Use the prompt-caching guide to verify cached-token fields and cost; a cache hit can change latency and must not be silently mixed into an uncached cohort.
- Use the API provider comparison for current commercial terms, endpoint choice, privacy, and provider due diligence.
- Use the GLM-5.2 benchmark hub to keep this original route observation separate from publisher scores and independent third-party speed reports.
Keeping those intents separate prevents an alluring but invalid conclusion: a model benchmark score does not specify API responsiveness, and one fast stream does not validate coding quality.
Questions this small test can and cannot answer
Section titled “Questions this small test can and cannot answer”Does the first SSE event equal the latency a user experiences?
Section titled “Does the first SSE event equal the latency a user experiences?”Not necessarily. The first event may be role metadata, an empty delta, or hidden reasoning. Record it for protocol diagnostics, but use the first non-empty visible delta.content for an interface-facing wait metric.
Did three concurrent calls find a Coding Plan capacity limit?
Section titled “Did three concurrent calls find a Coding Plan capacity limit?”No. The bounded smoke group showed a wider observed tail on this account and path, but it cannot locate the bottleneck or define a provider limit. A capacity test needs more waves, declared rate control, failure accounting, and authorization appropriate to the product.
Why did a 1024-token allowance still return no visible answer?
Section titled “Why did a 1024-token allowance still return no visible answer?”On the strict exact-word prompt, reported reasoning consumed almost the entire allowance and the stream ended at length. That is a prompt-specific failure. Allocate room for hidden reasoning plus visible output, inspect the finish reason, and test real prompts rather than assuming one universal cap.
Is 186 completion tokens per stream second GLM-5.2 decode speed?
Section titled “Is 186 completion tokens per stream second GLM-5.2 decode speed?”No. It is our API completion-token count divided by a remote client interval from first visible content to [DONE] for a smoothly delivered subset. Network delivery and buffering remain inside the number. It cannot be compared directly with a provider’s accelerator-side or differently sampled throughput.
Should thinking be disabled for every latency-sensitive request?
Section titled “Should thinking be disabled for every latency-sensitive request?”This evidence does not support that rule. The relaxed five-pair group had visible answers in both modes, and its reasoning-to-content gap varied sharply. Choose thinking based on task acceptance, total latency, output budget, and cost—not one first-event timestamp.
Sources, files, and update boundary
Section titled “Sources, files, and update boundary”Primary product references:
- Z.ai Chat Completion API — streaming request fields, thinking controls,
reasoning_effortmapping, and output allowance. - Z.ai Streaming Messages — delta content, finish reason, usage, and
[DONE]. - Z.ai Deep Thinking — separate reasoning and visible-content streaming.
- Z.ai Coding Plan overview — product scope, supported model, and plan limits.
Measurement context:
- OpenRouter provider-performance methodology — separate latency, throughput, tail, uptime, and quality questions.
- OpenRouter routing criteria — rolling percentile concepts and performance-based preferences.
Original files:
- Sanitized raw timing and summary JSON
- Docker probe, three result files, evidence README, and screenshot source are archived with the July 28, 2026 repository revision.
The external source that prompted this test was discovered through AI HOT; AI HOT was used for discovery, not as factual evidence. One budgeted SERP query confirmed that generic provider-speed pages already dominate this intent, which is why this page publishes a narrower original measurement and its failure modes.
Recheck the official documents, model mapping, route terms, and your own distribution before making a current buying decision. Future updates should never merge a different endpoint, model revision, prompt class, region, account, or percentile method into these rows without a visible cohort boundary.